Binge Watching Propels Customer Satisfaction, But Canada’s Wireline Providers Need to Innovate, J.D. Power Finds
Videotron and SaskTel Rank Highest in Respective Segments for Seventh Consecutive Year
TORONTO: 20 June 2019 – TV Viewers in Canada love to binge watch, spending more than four hours in front of the screen per viewing session, according to the J.D. Power 2019 Canada TV Service Provider Satisfaction StudySM and the J.D. Power 2019 Internet Service Provider Satisfaction Study,SM released today. Nearly four in 10 customers (39%) say they indulge in marathon viewing through their TV service provider.
The study finds that binge watching is more popular among younger viewers, especially Gen Z1and Gen Y who are nearly twice as likely to binge-watch content across various platforms, compared with Pre-Boomers (55% vs 24%, respectively). Binge watching also is associated with higher customer satisfaction with the TV provider’s programming, and features and functionality of the service, compared with those who don’t binge. Younger audiences are twice as likely to use the streaming app and three times more inclined to use a secondary streaming account (such as Netflix) through the provider’s interface than Boomers and Pre-Boomers.
“On the upside, there is a trend of improvement in overall customer satisfaction since 2015,” said Adrian Chung, Director of the Technology, Media & Telecom Practice at J.D. Power in Canada. “However, this trend has plateaued. If TV and ISP providers want to remain competitive, they need to innovate and stay relevant to younger audiences. Availability and reliability of the service, wider content selection and enhancements to streaming apps and user interface are key areas that can positively affect satisfaction.”
Following are some key findings of the 2019 studies:
- Service disruption erodes satisfaction: Nearly one-third (31%) of internet service customers and 29% of TV service customers have experienced a service outage in the past three months. Service disruption has a significant effect on satisfaction levels. Satisfaction with the provider’s performance and reliability drops to 768 from 820 (on a 1,000-point scale) after the first incident among internet users and drops to 734 from 793 after the first incident among TV viewers. Satisfaction continues to decline as the number of incidents increase.
- Fix it right the first time: Only 60% of TV customers and 58% of internet service customers had their question or problem resolved during the first contact with their provider. Among TV customers who contacted their provider, 15% said they were unable to achieve resolution and, among internet service customers, 17% said their problem was not resolved. As problem or question resolution drags beyond the first contact, overall satisfaction declines significantly, dropping to 658 from 733 among internet users and to 686 from 748 among TV viewers.
- Technician visits—the last line of defense: Nearly half (49%) of service visits for internet users and 55% of service visits for TV viewers were done by technicians to resolve an issue that could not be rectified by a call center. While this often makes the providers’ service technicians the last line of defense in resolving a customer problem that couldn’t be fixed by other means, it still offers an opportunity to deliver an exceptional experience.
Study Rankings
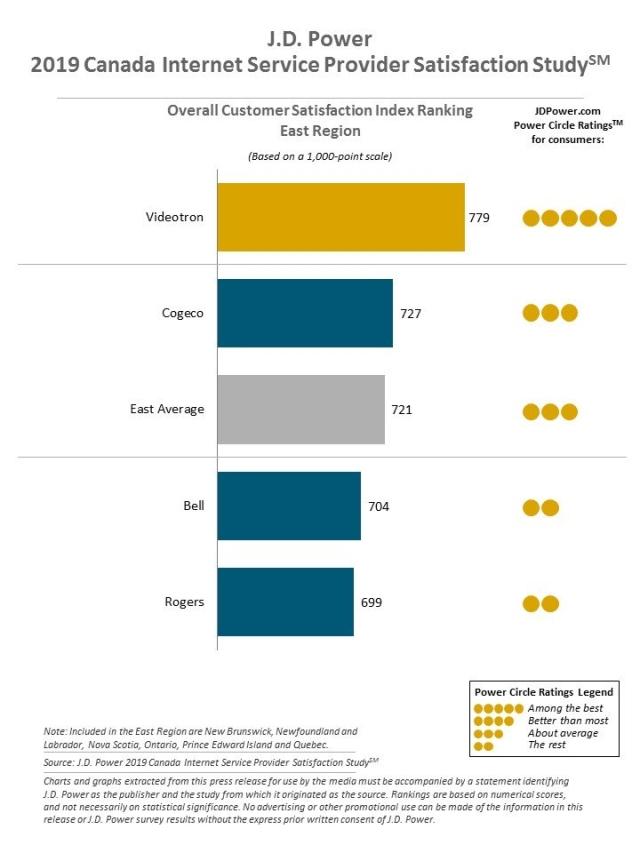
In the East region, Videotron ranks highest in both TV (780) and Internet Service Provider satisfaction (779) for a seventh consecutive year. Cogeco ranks second in TV satisfaction (730) and internet (727).
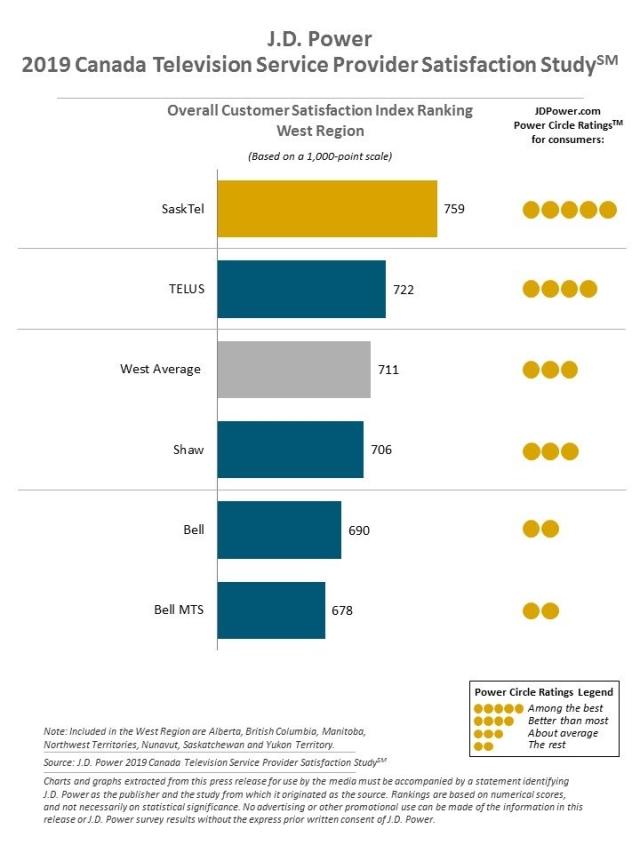
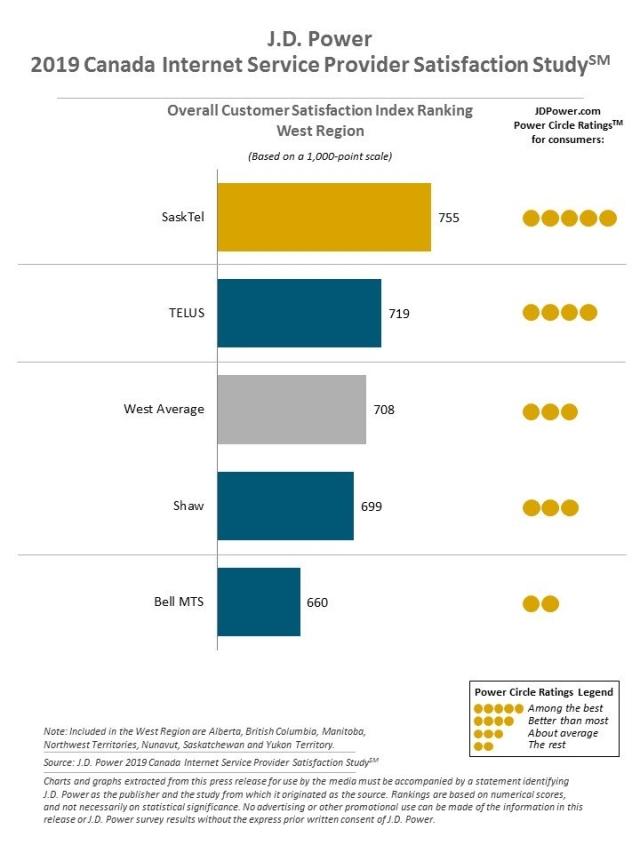
In the West region, SaskTel ranks highest in both TV (759) and Internet Service Provider satisfaction (755) for a seventh consecutive year. TELUS ranks second in this region for both TV satisfaction (722) and internet (719).
The 2019 Canada Television Provider Customer Satisfaction Study is based on seven factors (in order of importance): performance and reliability; cost of service; programming; communications and promotions; features and functionality; billing and payment; and customer service. The 2019 Canada Internet Service Provider Customer Satisfaction Study measures overall satisfaction with internet service providers and is based on five factors (in order of importance): performance and reliability; cost of service; communications and promotions; billing and payment; and customer service. The studies are based on responses from 6,443 internet customers and 6,389 TV customers in Canada. The studies were fielded in March-April 2019.
For more information about the Canada TV and ISP Satisfaction Studies, visithttps://www.jdpower.com/business/resource/canadian-wireline-satisfaction-study-ca.
J.D. Power is a global leader in consumer insights, advisory services and data and analytics. These capabilities enable J.D. Power to help its clients drive customer satisfaction, growth and profitability. Established in 1968, J.D. Power has offices serving North America, South America, Asia Pacific and Europe.
Media Relations ContactsGal Wilder, Cohn & Wolfe; 647-259-3261; gal.wilder@cohnwolfe.ca
Sandy Caetano, Cohn & Wolfe; 647-259-3288: sandy.caetano@cohnwolfe.ca
Geno Effler, J.D. Power; Costa Mesa, Calif.; 714-621-6224; media.relations@jdpa.comAbout J.D. Power and Advertising/Promotional Rules: http://www.jdpower.com/business/about-us/press-release-info
1J.D. Power defines generational groups as Pre-Boomers (born before 1946); Boomers (1946-1964); Gen X (1965-1976); Gen Y (1977-1994); and Gen Z (1995-2004). Millennials (1982-1994) are a subset of Gen Y.