Increasing Data Demands from Mobile Features and Apps Strain Canadian Wireless Network Performance, Says J.D. Power Study
Bell Mobility, TELUS Mobility and Videotron Tie for Highest Rank in the East Region; TELUS Mobility Ranks Highest in the Ontario Region; and SaskTel and TELUS Mobility Tie for Highest Rank in the West Region in Network Quality Performance
TORONTO: 26 May 2016 — Canadian wireless carriers are feeling the strain as more customers use data-heavy apps and features on the their phone stressing overall network quality performance, according to the J.D. Power 2016 Canadian Wireless Network Quality Study,SM released today.
The study examines wireless carriers’ network performance in three areas: calling, messaging and data. Network performance issues are measured as problems per 100 (PP100) connections, with a lower score reflecting fewer problems and higher network performance. Carrier performance is examined in three geographic regions: East, Ontario and West.
Overall network problems have risen to 10 PP100 from 9 PP100 in the 2015 study, largely due to an increasing use of mobile apps and features, which is driving data problems upward by 1 PP100 to 15 PP100. However, the incidences of calling problems (13 PP100) and messaging problems (5 PP100) have remained stable.
In particular, usage incidences for most wireless phone features have increased from 2015, including those that use relatively large quantities of data such as video chatting (18% from 14% in 2015); share location (14% from 10%); and mobile payments (19% from 14%). Similarly, the incidence of customers who use apps on their smartphones has risen to 86% from 84% in 2015. For example, the usage of social networking apps during the previous seven day period has grown to 56% from 52%; Web browser use is up to 42% from 39%; and health and fitness app usage has increased to 18% from 15%.[1]
“The storage capacity and processing power of new devices provides consumers with an abundance of available apps prompting a rapidly rising consumption of data,” said Adrian Chung, director at J.D. Power. “This is placing a great deal of stress on network performance. Despite carrier infrastructure upgrades and claims of faster speeds, consumer perception is compromised when they experience disruptions and delays.”
Customers are also visiting more websites on their mobile phones than they did last year, with 11.1 sites, on average, visited during the previous 48 hours, compared with 10.1 visits in 2015. Among customers who visit a higher number of websites, there is a greater number of data problems experienced. For example, customers who visited from 5 to 9 websites in the previous 48 hours experience 13 data PP100, compared with 17 PP100 among those who visited 10 to 14 websites.
Following are some key findings of the 2016 study:
- Higher Usage Associated with More Problems: The incidence of overall network problems is 13 PP100 among those with unlimited data vs. 11 PP100 among those with data caps. Both groups have experienced an increase of 1 PP100 in overall network problems from 2015.
- Speed Correlated to Problems: Customers who indicate the data speed on their 4G-compatible phone is slower than expected tend to experience a higher incidence of problems. Among wireless customers who have a 4G-compatible smartphone, 12% of those who own an LG device indicate their data speeds are faster than expected, compared with 10% of HTC owners, only 9% of Apple iPhone owners, 9% of Blackberry owners, and 9% of Samsung owners who indicate the same.
- Fewer Problems, Lower Propensity to Switch Carriers: Customers who say they "definitely will not" switch carriers within the next 12 months experience an average incidence of overall network problems of 6 PP100, compared with 19 PP100 among those who say they "definitely will" switch carriers.
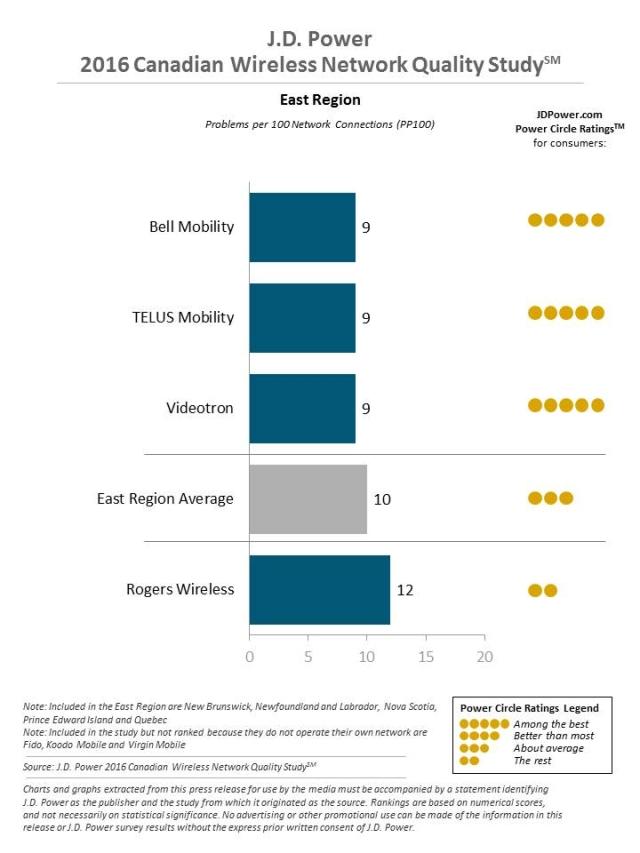
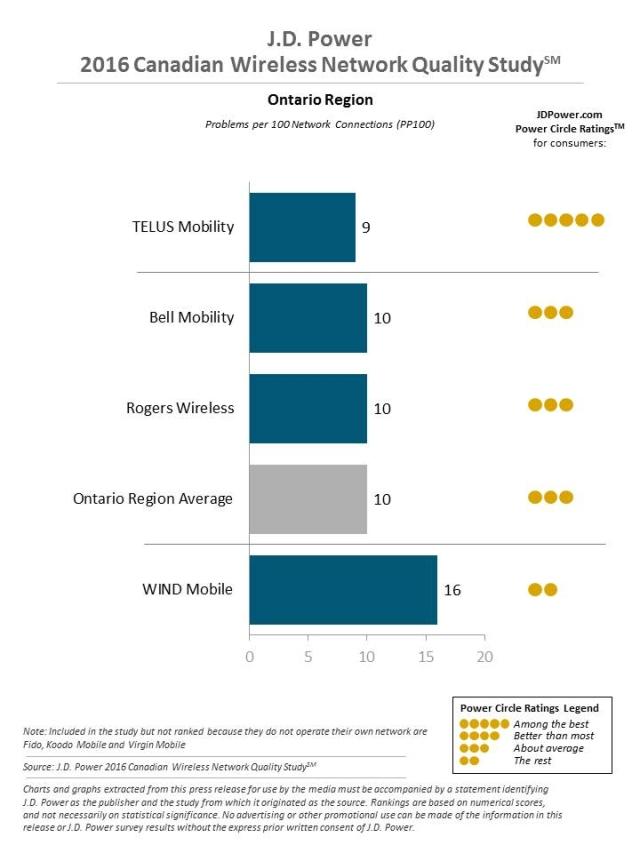
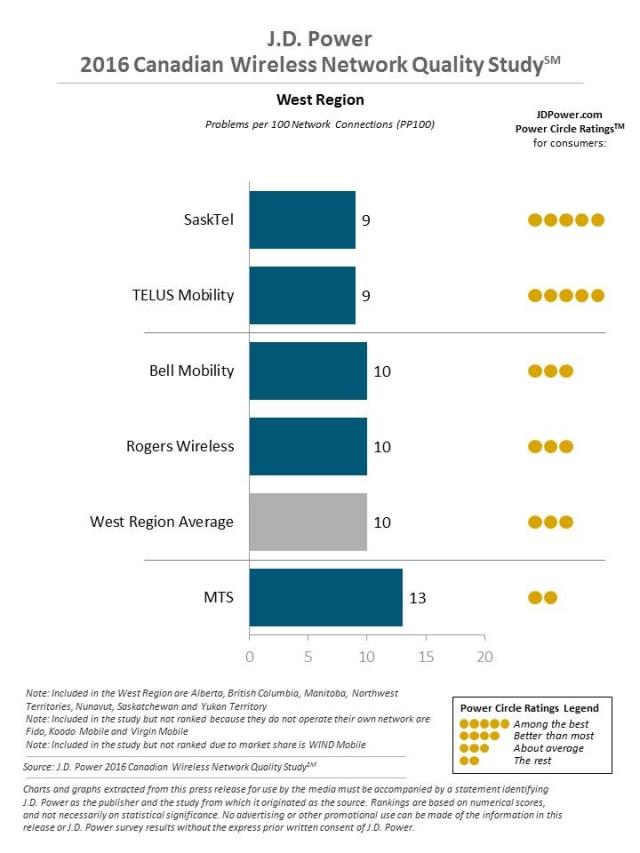
- Problems per Region: Wireless customers in the East region experience an average of 10 PP100, up from 8 PP100 in 2015, while the average incidence in Ontario is unchanged at 10 PP100. The number of problems experienced in the West region rises to 10 PP100 from 9 PP100 in 2015.
- Network Quality Lags in Rural Areas: Network problem incidence among rural customers (11 PP100) is higher than among those who live in suburban areas (9 PP100) and urban areas (9 PP100). The gap in problem incidences is greatest for data problems among rural customers (17 PP100), compared with among suburban and urban customers (14 PP100 each).
Wireless Carrier Rankings
In the East region, Bell Mobility, TELUS Mobility and Videotron tie ranking highest in overall network quality (9 PP100 each). Bell Mobility, Rogers Wireless, TELUS Mobility, and Videotron tie for the lowest incidence of messaging problems (5 PP100 each), which is on par with region average.
In Ontario, TELUS Mobility ranks highest in overall network quality (9 PP100), with its customers experiencing the lowest incidence of calling problems (11 PP100) in the region.
In the West region, SaskTel and TELUS Mobility rank highest in a tie in overall network quality (9 PP100 each), achieving a slightly lower overall problem rate than region average (10 PP100). SaskTel performs well with messaging problem incidence (4 PP100) and TELUS Mobility ties SaskTel for lowest calling problem incidence (11 PP100).
The 2016 Canadian Wireless Network Quality Study was conducted online in English and French. The overall problems per 100 (PP100) includes seven wireless carriers in the East; seven wireless carriers in Ontario; and nine wireless carriers in the West. Sample respondents were sent an email invitation with a link to the survey.
Wave 1 of the study is based on 2,210 responses in the East; 2,383 responses in Ontario; and 2,759 responses in the West collected between August 27, 2015 and September 22, 2015. Wave 2 of the study is based on 2,298 responses in the East; 2,329 responses in Ontario; and 2,764 responses in the West; and collected between March 1, 2016 and March 21, 2016.
Overall network performance is based on 10 problem areas that impact the customer experience: dropped calls; calls not connected; audio issues; late or failed voicemails; lost calls; text message transmission failures; late or failed text message notifications; Web connection errors; slow downloads; and email connection errors.
Media Relations Contacts
Gal Wilder, Cohn & Wolfe, Toronto, Canada; 647-259-3261, gal.wilder@cohnwolfe.ca
Jennifer McCarthy, Cohn & Wolfe, Toronto, Canada; 647-259-3305, jennifer.mccarthy@cohnwolfe.ca
John Tews, J.D. Power, Troy, Michigan; 248-680-6218, media.relations@jdpa.com
For information about the 2016 Canadian Wireless Network Quality Study, visit http://canada.jdpower.com/industry/telecom-ca
See the online press release at http://www.jdpower.com/press-releases/2016-canadian-wireless-network-quality-study
About J.D. Power and Advertising/Promotional Rules http://www.jdpower.com/about-us/press-release-info
[1] Source: J.D. Power 2016 Canadian Wireless Total Ownership Experience Study and the J.D. Power 2015 Canadian Wireless Total Ownership Experience Study