Connected Devices, Smart Home Technology Change Expectations in Canada for TV and Internet Service Providers, J.D. Power Finds
Videotron and SaskTel Rank Highest in Respective Regions for Sixth Consecutive Year
TORONTO: 21 June 2018 — As smart home appliances and Internet of Things (IoT) devices are increasingly making their way into Canadian households, they are changing the dynamics and expectations of consumers for their internet service providers (ISPs), according to the J.D. Power 2018 Canada Television Service Provider Customer Satisfaction StudySM and J.D. Power 2018 Canada Internet Service Provider Customer Satisfaction Study.SM
Customer satisfaction with their ISP increases with the number of connected devices being used at home. Overall satisfaction is higher among customers with two or more connected devices (742 on a 1,000-point scale) than among those with only one connected device (721) or none (713).
Study findings show that customers with smart home products are less price-sensitive and are willing to pay more for better service. Nearly two-thirds (63%) of customers with smart home products indicate having a willingness to pay more for internet service, compared with only 50% of those with no smart home devices. However, while these findings are good news for ISPs, they do come with a caveat: customers with connected devices are the least loyal to their internet providers and will easily switch for reasons such as better features (24%); more reliable service (22%); or just to try something different (21%).
“Technology advancements continue to influence the way consumers use the internet,” said Adrian Chung, Director of the Technology, Media & Telecom Practice at J.D. Power in Canada. “They’ve become enablers in peoples’ lives and, as such, customer expectations of service providers are evolving. Reliability and faster speeds are increasingly more important factors in customer expectations and satisfaction, especially among younger and more tech-dependent users. The ability of ISPs to unlock the potential of their premium service offerings will be critical to success as adoption rates of connected and smart homes devices increase.”
Following are some key findings of the 2018 studies:
- Younger generations make homes smarter: Nearly 1 in 5 Gen Z[1] and Gen Y customers have a smart home device connected to their home internet (21% and 18%, respectively), compared with only 5% of Pre-Boomers and 8% of Boomers. Younger customers also are more likely to own multiple devices. Smart Security and Smart Appliances are the most common smart home applications.
- Gaming consoles not just for games: Nearly every internet customer surveyed (96%) has some type of gaming device that is connected to the internet and 22% own a dedicated internet-connected gaming console (e.g., PlayStation, Xbox and Wii). Owners of dedicated internet-connected gaming consoles are more likely to cut ties with wireline TV service providers, with 32% watching streaming content on their device. Additionally, 15% of console owners plan to drop their TV service in the next 12 months, citing streaming service as their most likely product to switch to.
- Loss of television service leads to lower satisfaction: Customers who experience a loss of television signal or service are significantly less satisfied than those who do not experience such an issue (739 vs. 831, respectively). Nearly half (48%) of customers have experienced this issue in the past three months.
- PVR owners more likely to binge-watch: Nearly half (48%) of TV service subscribers who own a PVR say they have binge-watched programming from their provider, compared with only 36% of those without a PVR.
Study Rankings
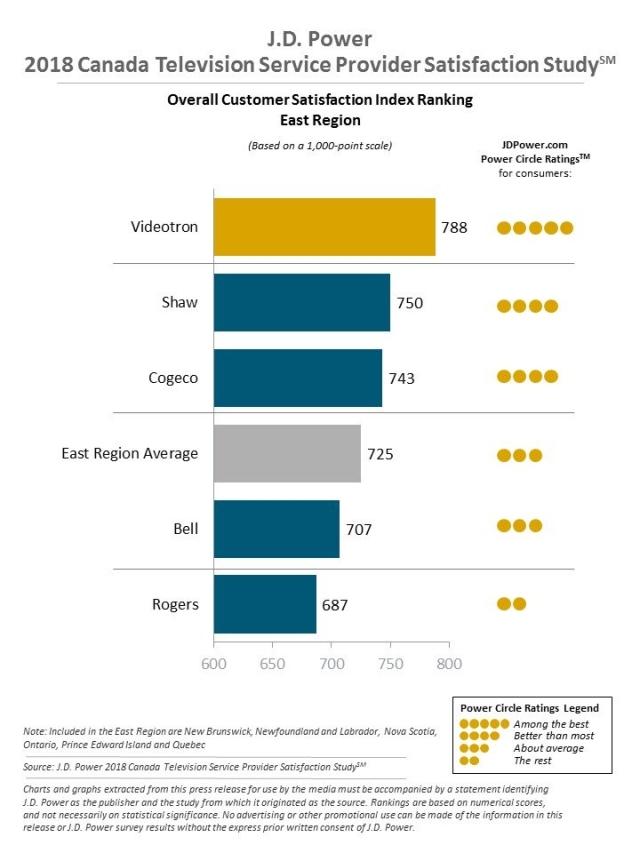
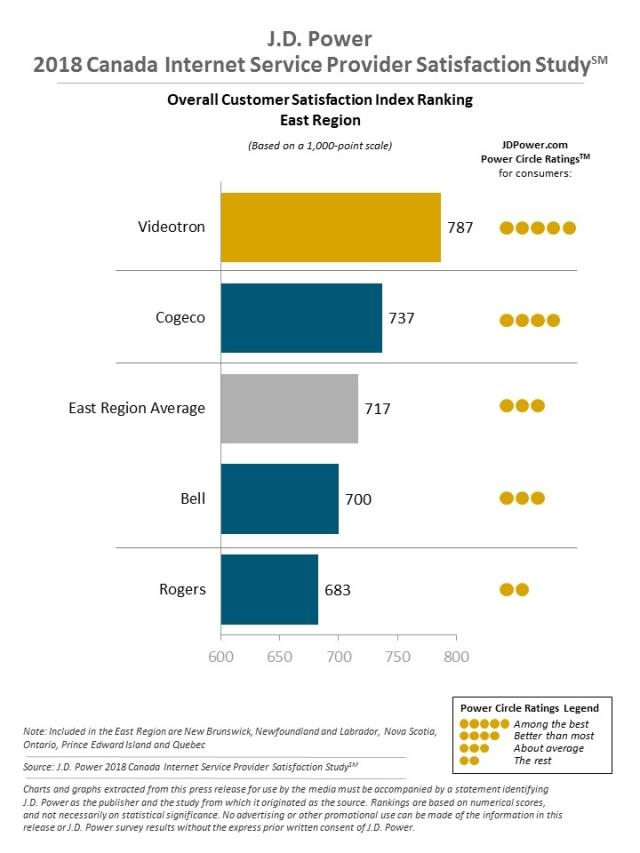
In the East region, Videotron ranks highest in both TV (788) and internet service provider satisfaction (787) for a sixth consecutive year. Shaw (750) ranks second in TV satisfaction. Cogeco ranks third (743) in TV satisfaction and second in internet service (737).
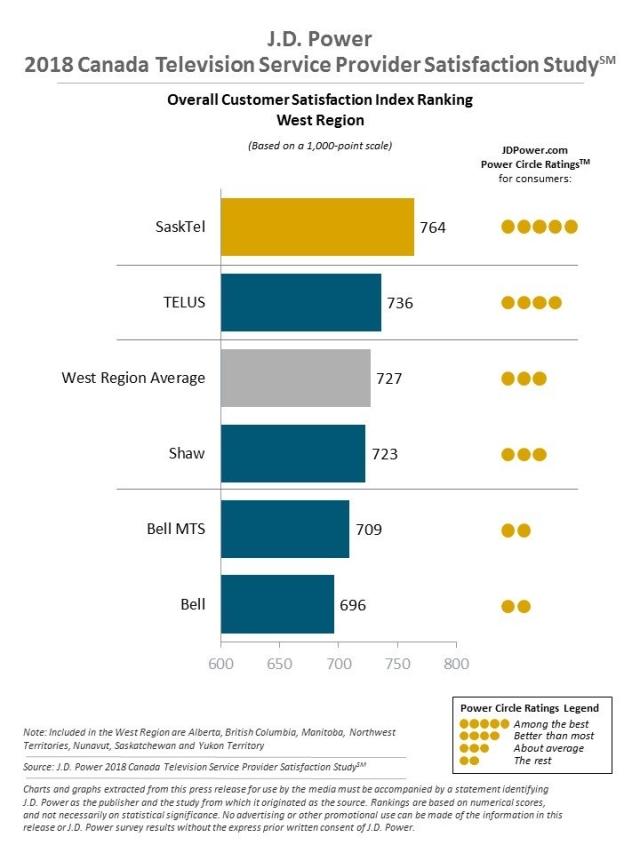
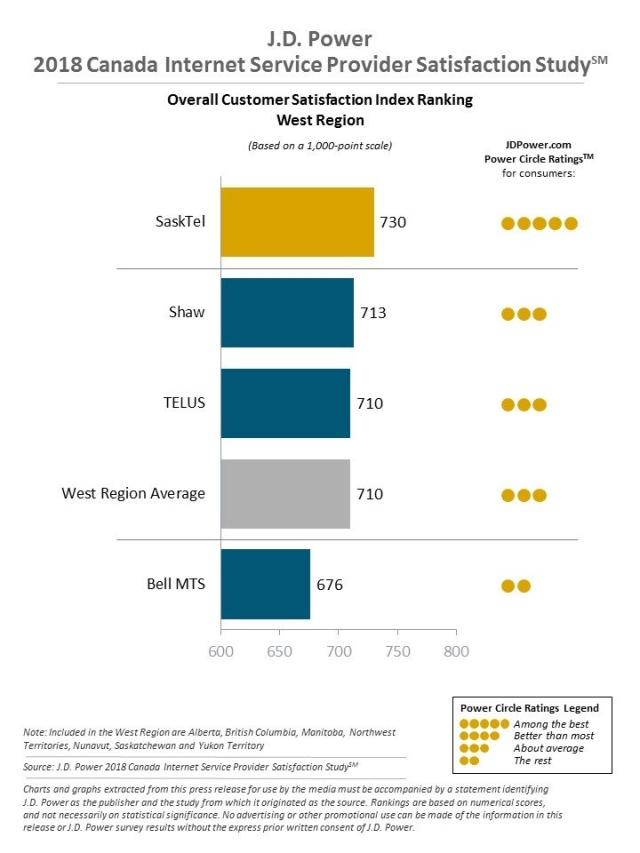
In the West region, SaskTel ranks highest in both television (764) and internet service satisfaction (730) for a sixth consecutive year. In TV satisfaction, TELUS (736) ranks second and Shaw (723) ranks third. In internet service provider satisfaction, Shaw (713) ranks second and TELUS (710) ranks third.
The 2018 Canada Television Provider Customer Satisfaction Study is based on six factors (in order of importance): performance and reliability; cost of service; programming; communication; billing; and customer service. The 2018 Canada Internet Service Provider Customer Satisfaction Study measures overall satisfaction with internet service providers and is based on five factors (in order of importance): performance and reliability; cost of service; communication; billing; and customer service. The studies are based on responses from 7,286 internet customers and 7,342 TV customers in Canada. Both studies were fielded in March-April 2018.
For information about the Canada Television and Internet Service Provider Satisfaction studies, visit http://canada.jdpower.com/business/resource/canadian-wireline-satisfaction-study-ca.
J.D. Power is a global leader in consumer insights, advisory services and data and analytics. These capabilities enable J.D. Power to help its clients drive customer satisfaction, growth and profitability. Established in 1968, J.D. Power is headquartered in Costa Mesa, Calif., and has offices serving North/South America, Asia Pacific and Europe. J.D. Power is a portfolio company of XIO Group, a global alternative investments and private equity firm headquartered in London, and is led by its four founders: Athene Li, Joseph Pacini, Murphy Qiao and Carsten Geyer.
Media Relations Contacts
Gal Wilder, Cohn & Wolfe; Toronto, Canada; 647-259-3261, gal.wilder@cohnwolfe.ca
Sandy Caetano, Cohn & Wolfe; Toronto, Canada; 647-259-3288, sandy.caetano@cohnwolfe.ca
Geno Effler; J.D. Power; Costa Mesa, Calif.; 714-621-6224; media.relations@jdpa.com
About J.D. Power and Advertising/Promotional Rules www.jdpower.com/business/about-us/press-release-info
[1] J.D. Power defines generational groups as Pre-Boomers (born before 1946); Boomers (1946-1964); Gen X (1965-1976); Gen Y (1977-1994); and Gen Z (1995-2004). Xennials (1978-1981) and Millennials (1982-1994) are subsets of Gen Y.